
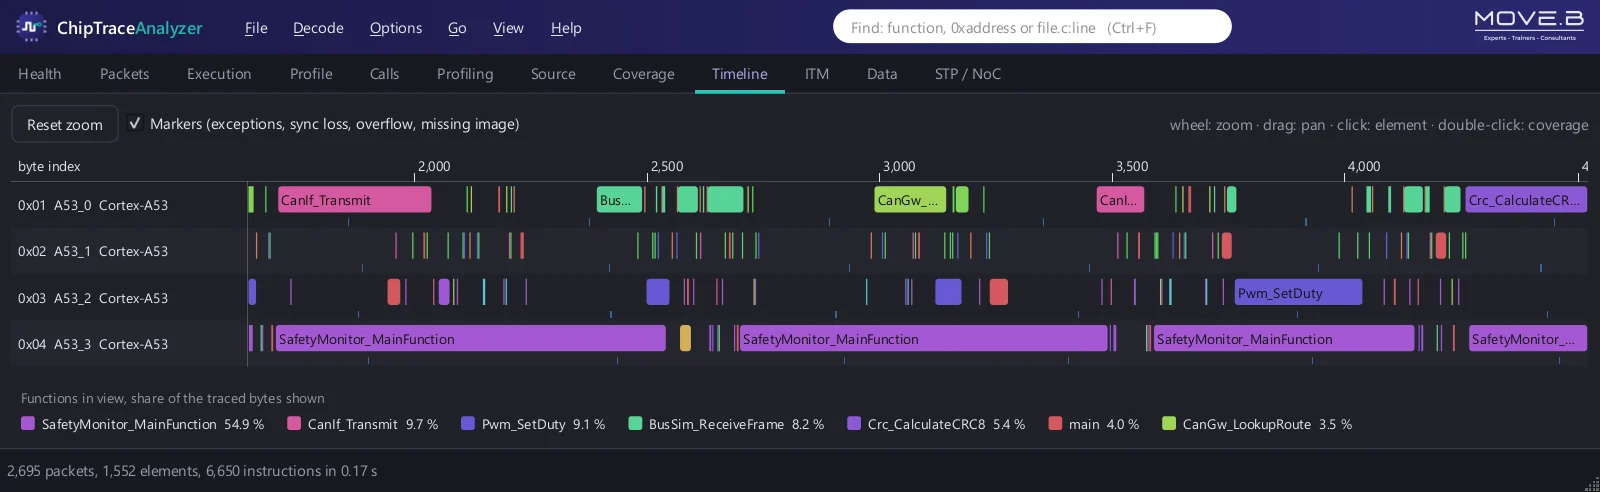
4 cores, 4 rolesCAN gateway, sensor fusion, motor control and safety monitor, side by side
0.2 sto decode the 8 KB ETR buffer: 2,695 packets, 6,650 instructions
1 faulty framewith a stale alive counter: the trace shows the error path it took
1
What it is
The host side of ChipTrace: from a raw buffer to answers.
It reads the captured buffer with the ELF that ran and rebuilds every core's execution. Decoding by OpenCSD, the open-source CoreSight decoder of Linaro and Arm.
A desktop application, on Windows and Linux.
No TRACE32 licence needed to decode and analyse.
Nothing added to the target: no instrumentation, no rebuild for coverage.

ChipTraceAnalyzer
Developed by MOVE.B. Embedded decoder: OpenCSD 1.8.3.
2
From capture to answers in a few clicks
Drop a capture folder: the rest sets itself up.
1
Open
Drop the capture's folder on the window.
2
Auto-setup
SoC, ELF and trace sources found on their own.
3
Decode
One key. The Health view says if you can trust it.
4
Analyse
Profile, calls, coverage, timeline, messages.
5
Report
An HTML or PDF report, or CSV.
Ready for every SoC ChipTrace supports; any other CoreSight target can be described by hand.
3
What you see
Real captures of an S32G3 ECU. Every view links to the others.
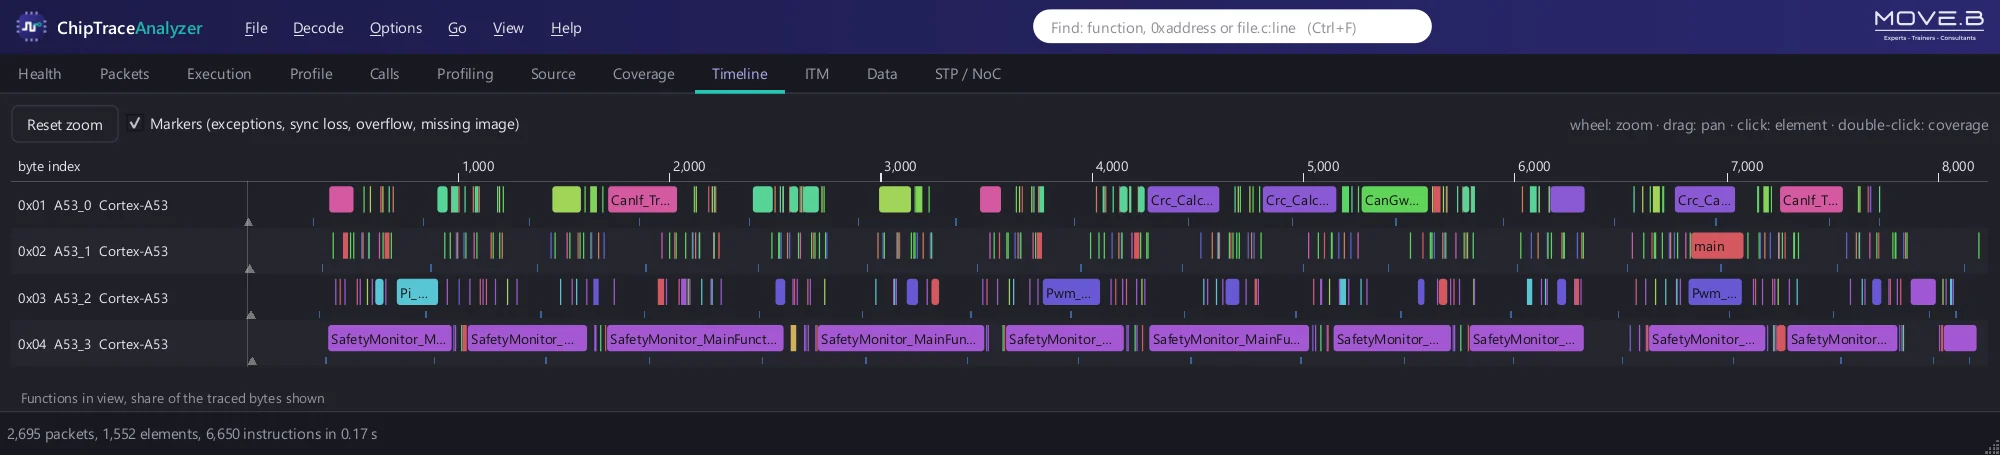
Four cores, four ECU functions, one time axis. Click a segment to see its instructions.
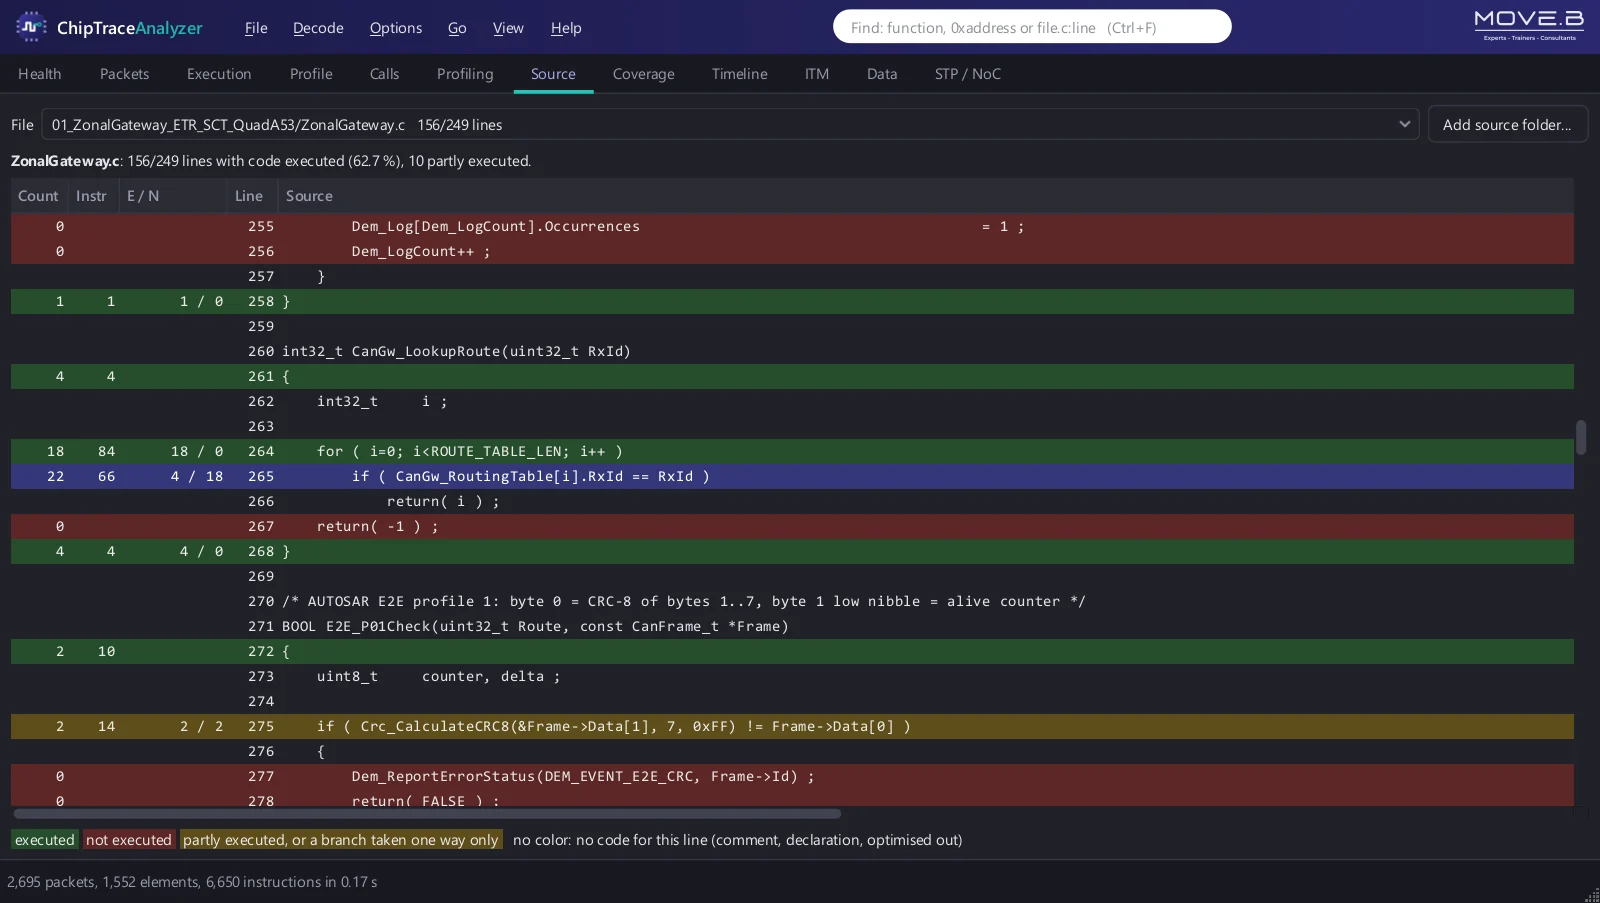
E2E_P01Check() as it ran: the alive-counter error path taken once, the CRC error path never (red).
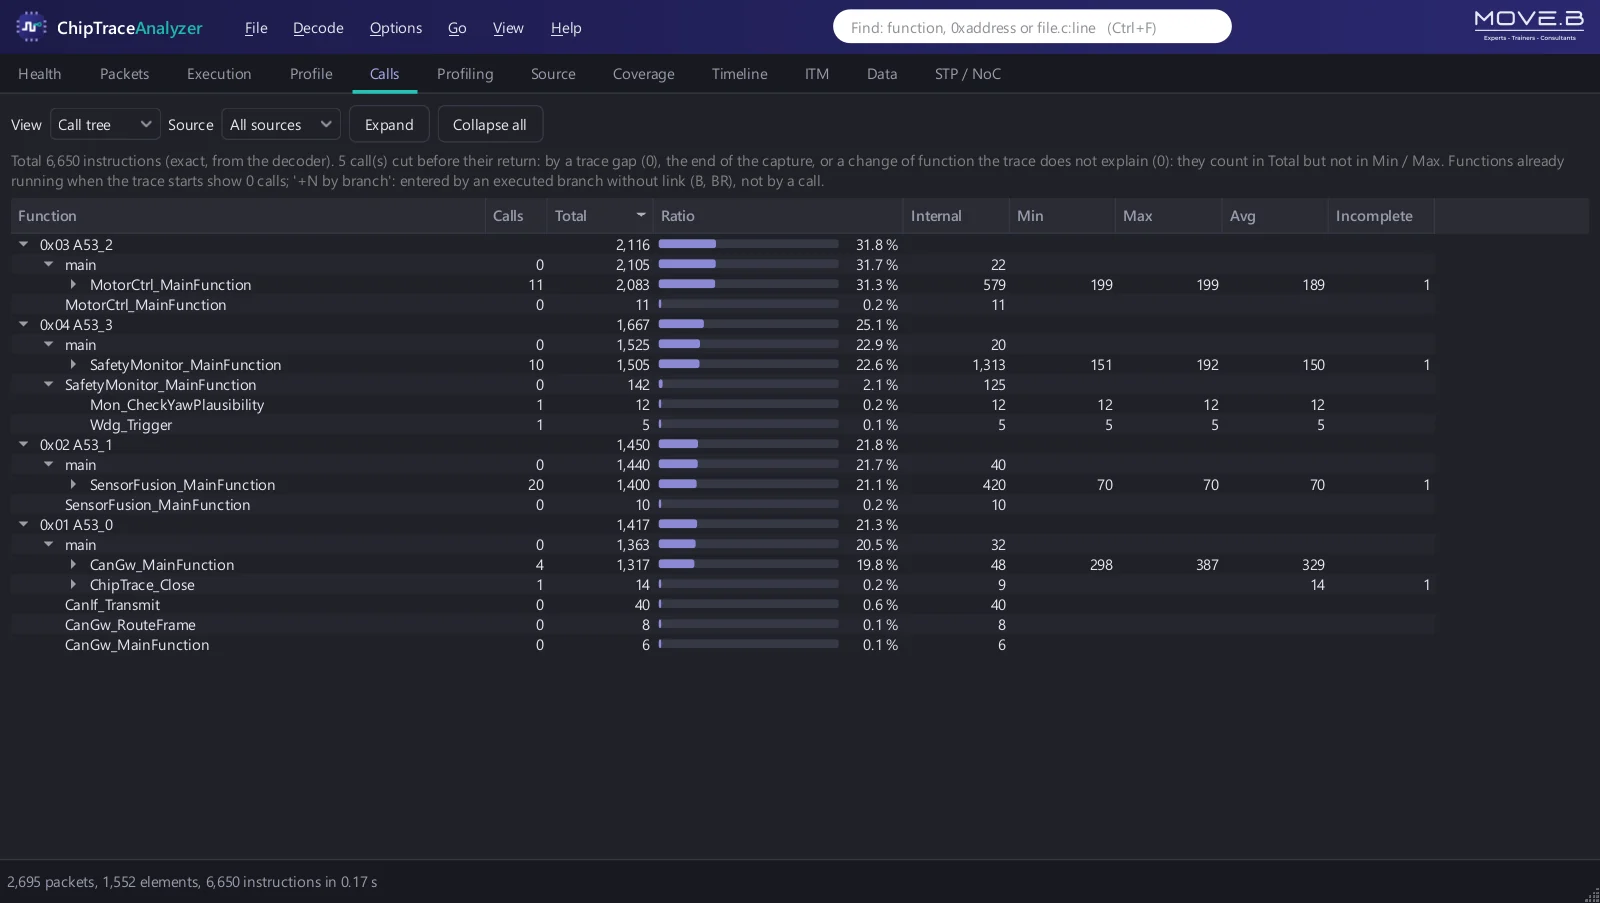
Who called whom, how often and at what cost, rebuilt only from what the trace proves.
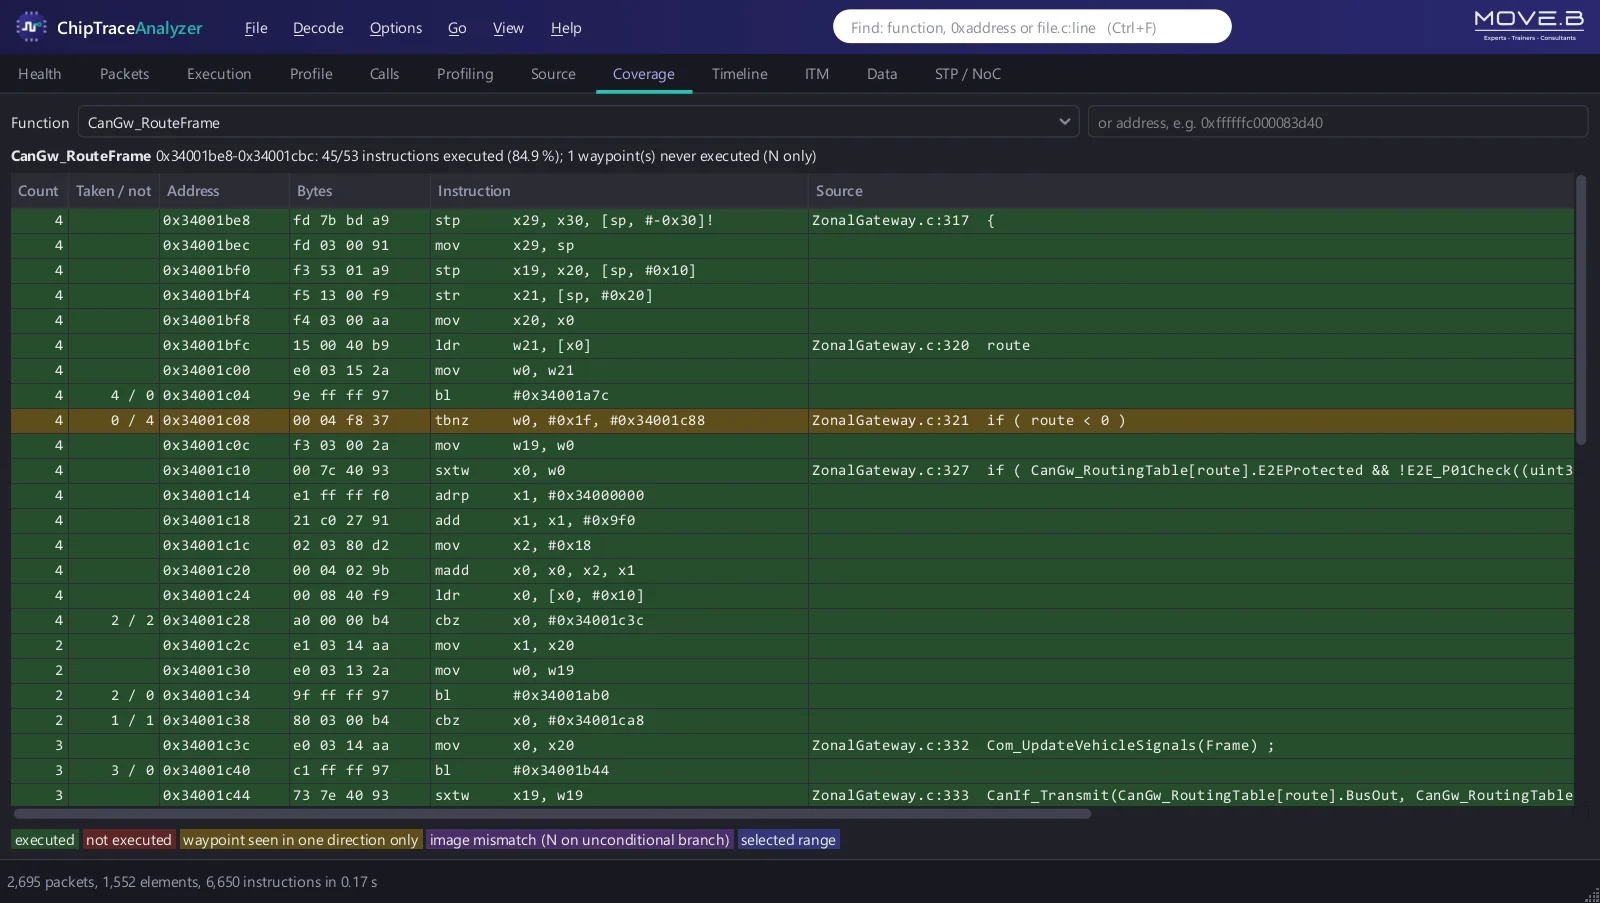
Every branch, taken or not, each block linked to its C line.
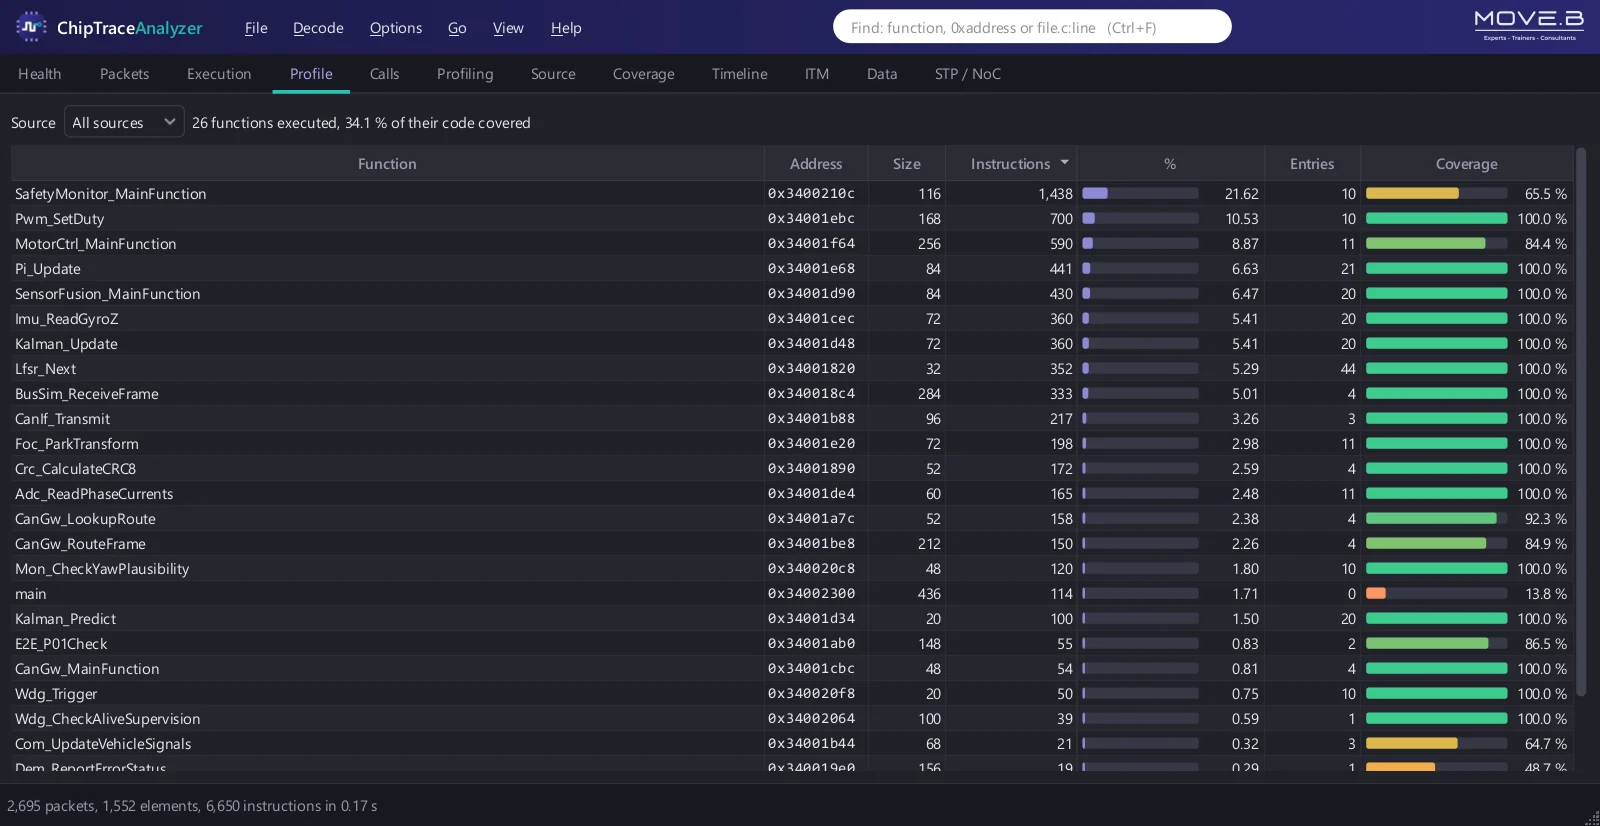
The 26 functions of the window: instructions, share, calls, coverage.
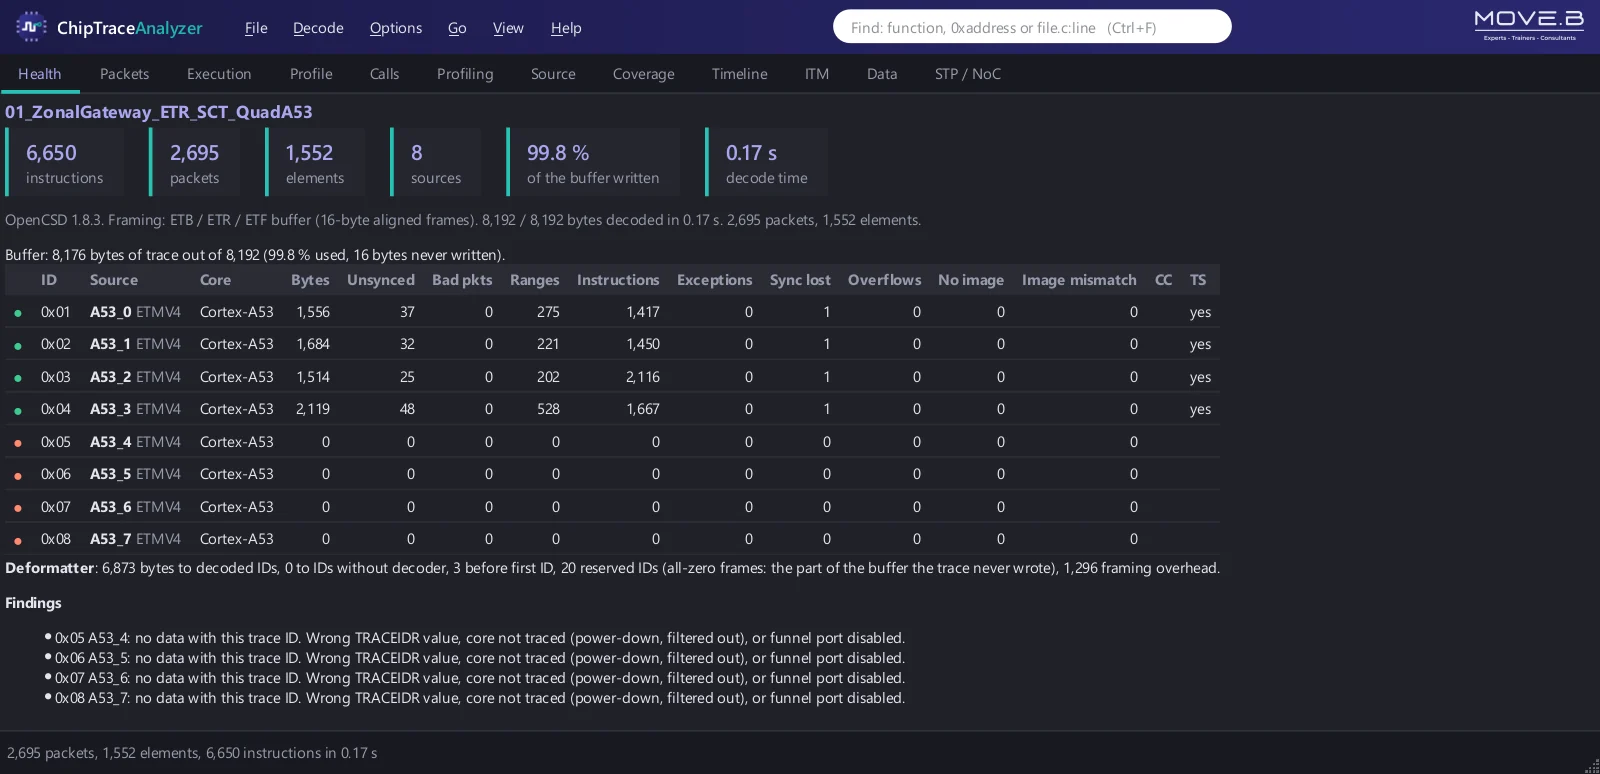
Read first: sync, overflows, image mismatches, buffer fill (99.8 % here).
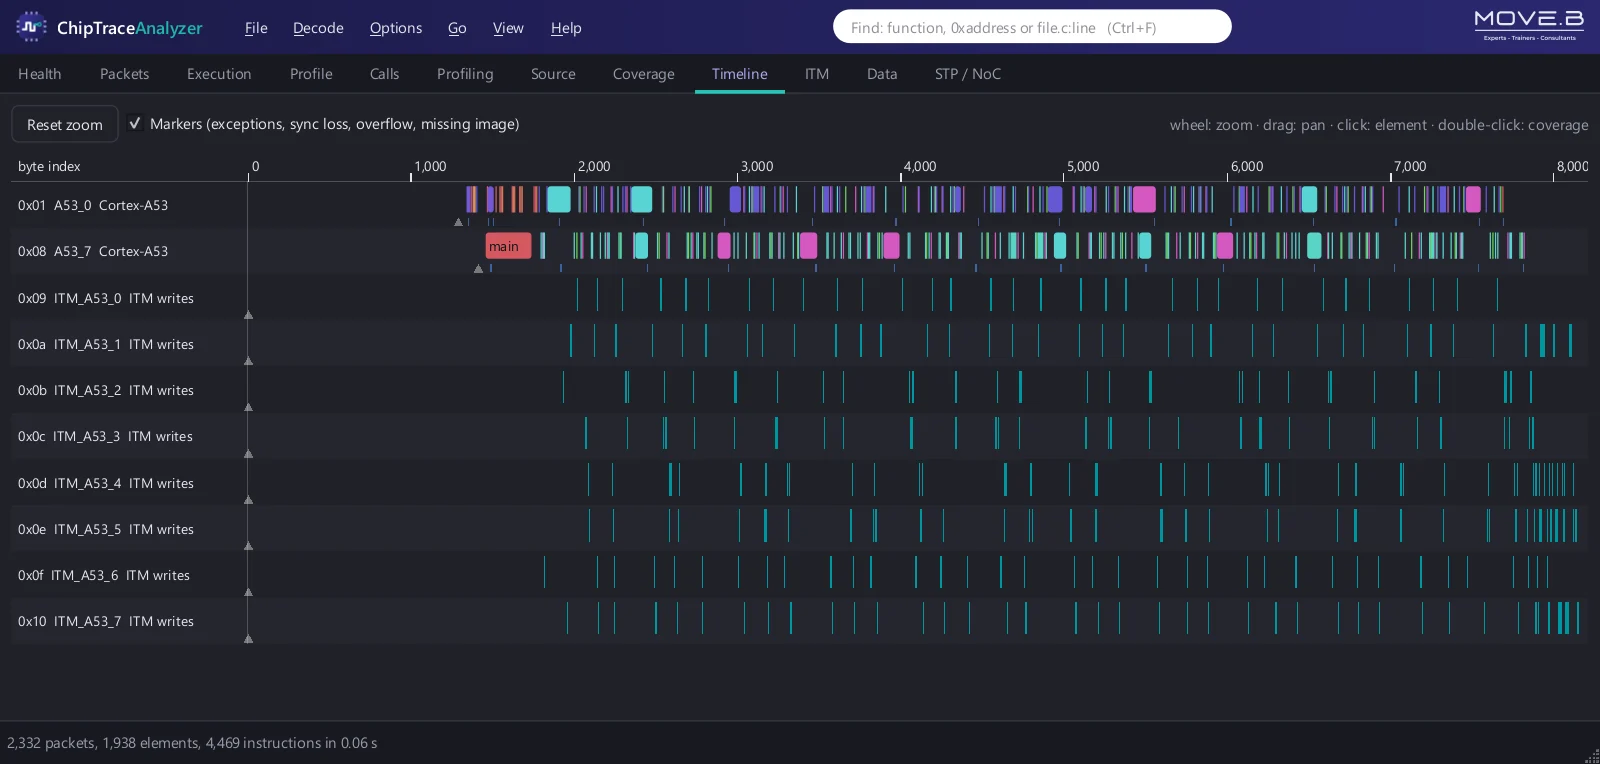
What the code reported, next to what it executed, on the same axis.
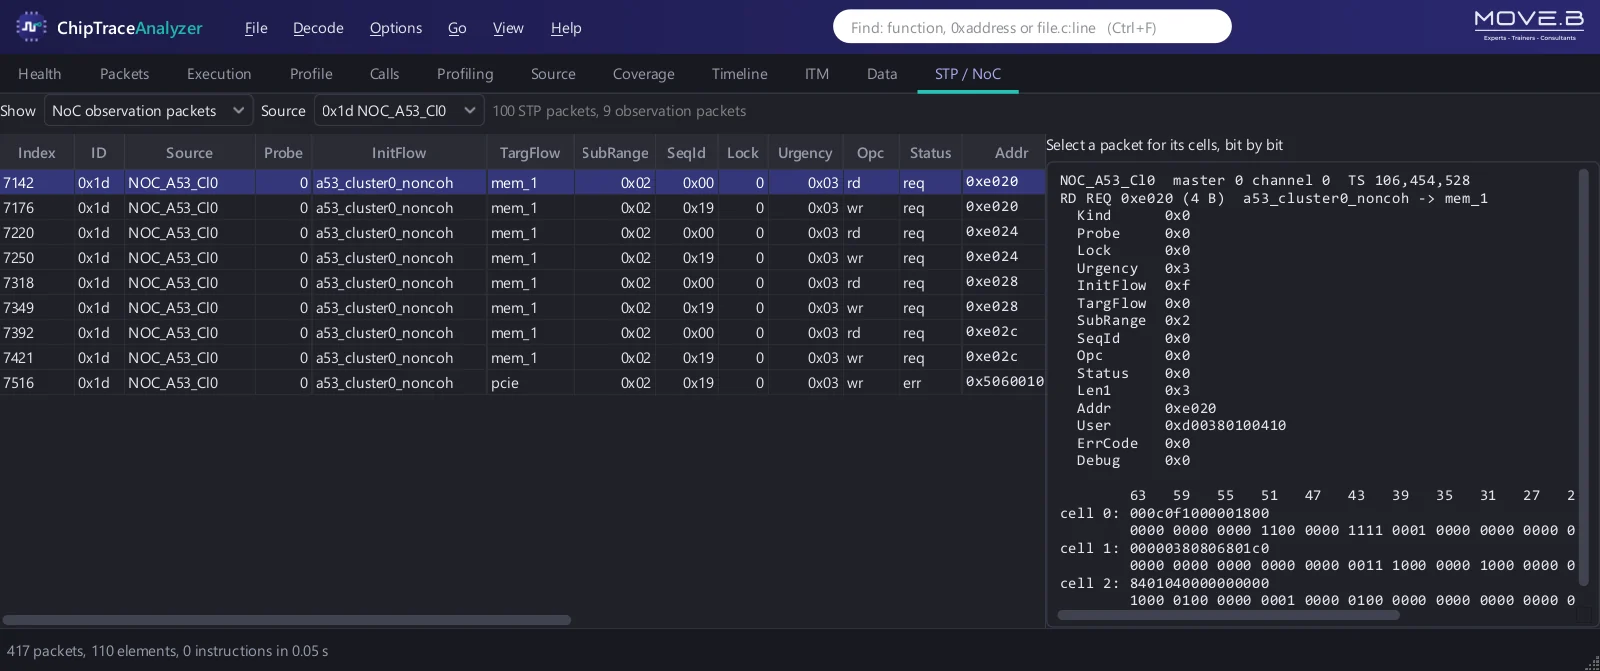
Arteris FlexNoC packets from the S32G3 interconnect, decoded field by field.
4
Coverage evidence
On the binary that ships, accumulated across runs.
Coverage across runs. Captures of the same build add up; another build is refused.
Reports to hand over. One HTML file or a PDF.
Data to reuse. Every result tab exports to CSV.
5
Inputs, validation and limits
What it reads, how it was checked, and what it does not do yet.
| Input | Supported |
|---|---|
| Trace protocols | ETMv3, PTM, ETMv4, ETE, ITM / DWT, STM, FlexNoC |
| Captures | ETB / ETF / ETR buffers, TPIU captures, CoreSight snapshots |
| Program images | ELF with DWARF, raw binaries, symbol files |
| Outputs | GUI, HTML / PDF reports, CSV |
How it was validated
Compared with OpenCSD's own reference on its whole test suite, and to TRACE32 row by row on the ChipTrace captures.
Known limits
The timeline shows amounts of trace, not exact durations. Data trace (Cortex-M7, Cortex-R52) is read from memory buffers, not from a trace port.
MOVE.B training
Learn the trace ChipTrace relies on
The CoreSight units ChipTrace programs, the cores it traces and the SoCs it runs on, each one a MOVE.B course.